
PROJECTING A NEW PERSPECTIVE
How can data visualization help communicate issues about science, culture, or the environment?
This week we learned a variety of ways to tell stories using data visualization. I chose to leverage the 2019 San Francisco Point In Time Homeless Count and Survey Report for my data source. It is an annual report and summary that documents and details the state of homelessness in the city of San Francisco at a single point in time. This information is sourced through hundreds of interviews taking place all across the city. Over 600 community volunteers, City and County employees, and local community-based organizations assisted with all aspects of the count, from the initial planning meetings to the night of the count.
It is then compiled into an 70+-page report.
The homelessness in San Francisco is often national news. Each of the city’s mayors has attempted to resolve this issue unsuccessfully, and not for the lack of trying. Each year over 300 million dollars are spent on the homeless crisis in San Francisco, yet the numbers of homeless continue to grow.

The 2019 San Francisco Point In Time Homeless Count and Survey Report provides nearly eighty pages of data, which was more than enough for me to draw out some insights.
Looking at the last three years, it appears that the demographics of homelessness are shifting, yet the stigma or stereotypes are not. How many think of the homeless as addicted to drugs, criminals, or mentally unstable? I know I have.
When you read this report you can see that many of those that are without regular, self-made or supported ongoing shelter are actually just like you and me. They work, they pay bills, they have kids that go to school. They just don’t have a place to live.
Looking at five data points in particular, you can see how the stigma is off-base. The key insights I gathered are as follows (1-5, left-to-right):


70% of reported homeless are natives of San Francisco
30% are homeless due to a loss in employment
66% were living in their own home or with family or friends prior to becoming homeless
Most remain homeless because they cannot afford the sky-high cost of living in San Francisco
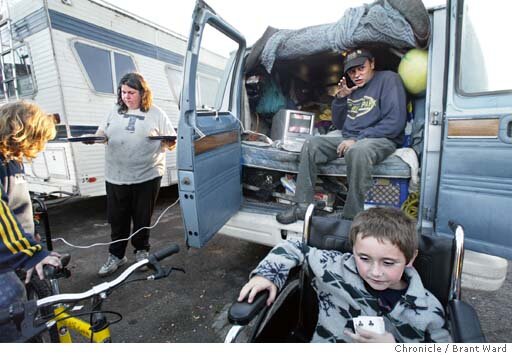
From 2017 to 2019, there has been a dramatic shift in where people are finding shelter. Fewer are living outdoors and nearly three times as many homeless are living in their cars as they were in 2017 compared to 2019
What does all of this mean? To me, I read this as we are leaving a large portion of our city’s own behind. There is now a tale of two San Franciscos: The “Haves” and the “Have Nots”.
I chose to illustrate my data visualization largely by hand and adding in texture and watercolor to connect the viewer to the very human issue that homelessness is. I also chose to leave the illustration of the city of San Francisco in black and white while coloring the data points in a subdued palette. This was to illustrate that these are living, breathing human beings that are left out. My visualizations were largely inspired by David McCandless via two of his books on data visualization: The Visual Miscellaneum, and Knowledge is Beautiful. Below is my final piece:
A Tale of Two Cities: 2019 San Francisco Point in Time Homelessness Report
REFERENCE:
2019 San Francisco Point In Time Homeless Count and Survey Report. (2020). Retrieved from http://hsh.sfgov.org/research-reports/san-francisco-homeless-point-in-time-count-reports/
DiSalvo, Carl (2012), ‘Chapter 2: Revealing Hegemony: Agonistic Information Design’ in Adversarial Design,(Cambridge, Mass: MIT Press).
Falmouth University (2018). Projecting a New Perspective | Lecture. History and Futures GDE720 19/20 Part-Time Study Block S2 (Falmouth, UK: Falmouth University)
Forensic Architecture research agency at Goldsmiths, University of London (2018), What is Forensic Architecture? 17 July. (Accessed: 7th December 2018)
It’s Nice That (2018), Nicer Tuesdays: Offshore Studio 12 June, (Accessed: 7th December 2018)
McCandless, D. (2014). Knowledge is beautiful. New York, NY: Harper Design, an imprint of HarperCollinsPublishers.
McCandless, D. (2012). The visual miscellaneum: a colorful guide to the worlds most consequential trivia. New York: Harper Design.